Every retail business in the world continues to experience some level of digital transformation. These shifts involve more than driving traffic to a website, efficiently filling online shopping carts and making sure your products get to consumers’ homes.
All the digital shifts retailers embraced through the years are now producing tremendous amounts of customer data. Data collection and analysis isn’t new, but the continued challenge remains: how does a retailer best use it? One survey from data analytics software company, Alteryx, found 81% of retailers said they gather shopper data; however, only 16% considered themselves experts in harnessing it.
Today, data has a hand in many things. Yes, it influences how to market a business online, but it can also be used to enhance your visual merchandising strategy inside your brick-and-mortar store. Here are three ways data can help you get the most out of your retail store displays.
The power of observational data in your visual merchandising strategy
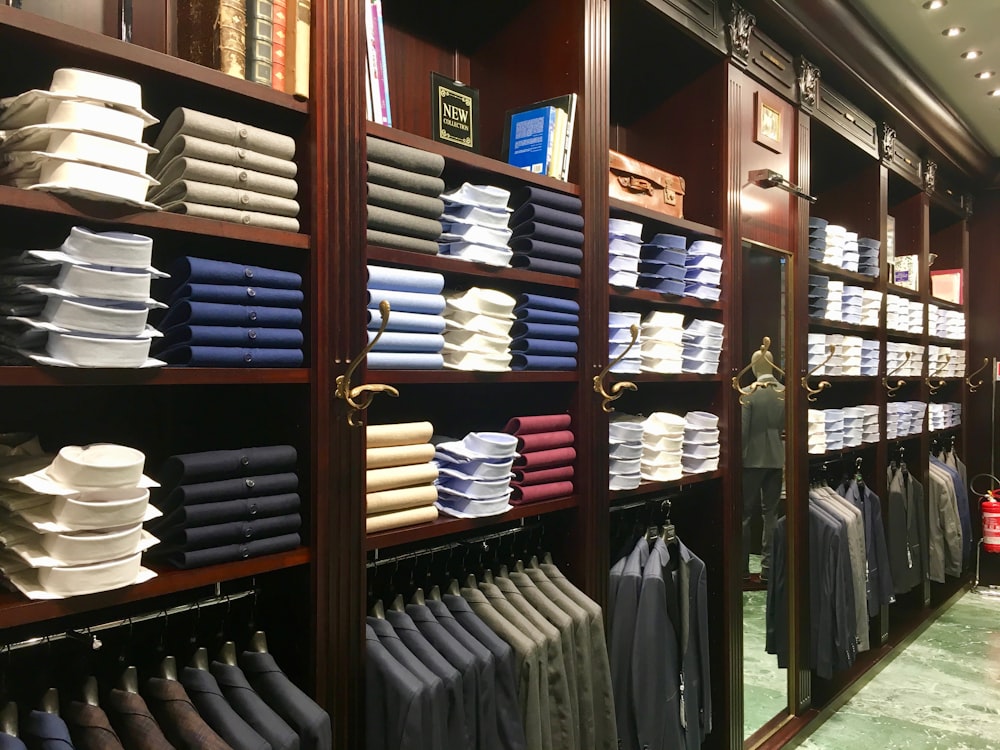
One core piece of visual merchandising strategy is product movement—not just out the door, but within the store itself. You can’t let items sit in one place for weeks on end. It takes time to sell certain products, and it’s very likely many may reside in several different display environments before selling. Clothes, for example, may be folded neatly on wall shelves one weekend, then thrust to the front of the store on a tiered display the following one.
It might be worth investing in an observational data-collecting technology. These solutions use video cameras and IoT sensors to monitor traffic in your store. They can offer a ton of great insights, including: customer dwell time with displays, traffic patterns in the store at certain times of day and in general, changes in foot traffic, and more. You can leverage this information to make important merchandising decisions.
Here are a few:
- Better understand when to move displays: Don’t just move seasonally. Adjust to daily, weekly and monthly traffic patterns.
- Locate layout hotspots and learn more: Observational data can help you maximize popular locations in your store. For example, if a rotating display of popular seasonal cards, calendars or books is hot right now because of the season, place items near it that encourage additional sales such as bookmarks, appropriately themed stationary, pens, etc.
- Make signage decisions: Observational data can also get you and your team out on the floor and problem solving. Sometimes, signage problems hamper display performance. Compare before and after data to see if where you place certain types of signs moves people where you want them. Data, and some trial and error experimenting, can help you create and answer important questions about whether this chrome poster stand, for example, belongs in the front of the store highlighting the sale or closer to the product itself.
Weigh the numbers, too
While observational data is vital for making good layout decisions, the old adage “the numbers don’t lie” has some sway in this conversation, too. Your POS system is your in-house number cruncher. It helps you gather key metrics like foot traffic, sales and customer profiles, and most do a great job of organizing the numbers.
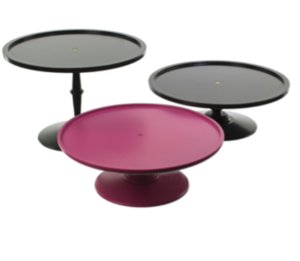
You can also tie the numbers to observational data and use the many “why” questions created to make your retail store displays even better. For example, both observational and sales numbers may confirm low dwell time in the store or at certain areas in your layout. Sometimes the slightest tweaks in presentation bring results. If you have a lot of merchandise in your store, for example, things may look cluttered or disorganized. Adding open space to your retail canvas and perhaps employing displays with risers to help items stand out could improve the customer experience and create more high-conversion displays.
Compare online and in-store data
Compare your brick-and-mortar POS sales data with online findings. You’ll likely see differences in how people do business with you online versus in-person. Even better, compare data between those who exclusively shop online and those who shop both in-store and through your website. Ask yourself: what gets them to shop in the store? Leverage your understanding of online versus in-store preferences and look for ways to encourage customers into your brick-and-mortar store. The move is well worth it, as these shoppers are more likely to add more items to their carts than online shoppers.
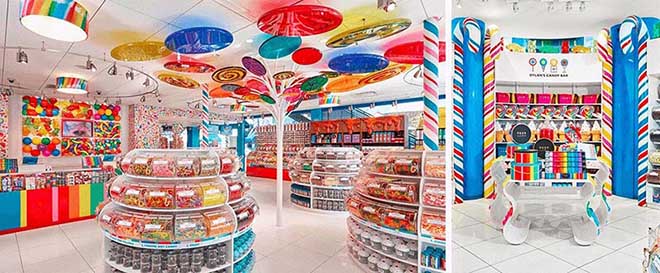
Once you get them in the door, the data lets you know what they’re likely seeking, but you can also bring the wow factor. We helped the iconic Dylan’s Candy Bar create an environment that was absolutely irresistible for shoppers—one that helped increase sales and improve the customer experience, partly because data was used to better understand that shopper’s desires for signature items in a functional, but visually appealing display.
In conclusion — your visual merchandising strategy needs to be backed by data
Today, data is so much more than a numbers game. Use it well, and you can create unforgettable retail experiences for your valued customers. For more than 40 years, ShopPOPdisplays has been helping everyone from mom-and-pop retailers to major national brands create displays and environments that keep customers coming back. Let us help you use your data to build displays that make your business thrive.