Retail is a rapidly changing business. In fact, how we purchase has changed immensely in just the last five years. From eCommerce, to pop-up shops to brick and mortar, there are a lot of areas for consideration when choosing which direction you want your store to take. Over the years, we at shopPOPdisplays have seen a number of these changes in the industry through our collaborations with large brands and retailers.
These statistics and trends should be able to help you leverage the potential of your in-store brand, expand on customer loyalty, and get ahead of the competition.
The Value of In-Store Transactions
- Retail and in-person connections are just as valuable in the digital age as they were before. Consider the following:
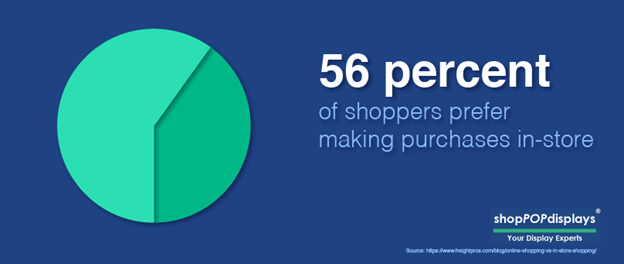
- 56 percent of people would rather purchase in store.
- 86 percent of customers prefer to buy food in-store
- 60 percent of shoppers prefer to buy clothing in-store.
- Consumers of all ages still attribute physical stores as their first choice as a means of purchase, including 62 percent of Baby Boomers and 58 percent of Gen Z.
- Nearly 60 percent of Gen-Z prefer shopping in a brick and mortar store.
- 1 out of every 5 customers are planning to purchase in-store more often in the future. 70 percent of purchase decisions are made in-store.
- Although some news outlets claim the death of traditional retail, for every business closing a store, 2.7 businesses opened a store.
- In 2017, the top retailers estimated that nearly 77 percent of their sales would be as a result of in-store transactions and nearly 15 percent would be generated via ecommerce.
- E-commerce may be growing, but it still accounts for less than 15 percent of retail sales globally.
- When shoppers visit a retail location, they have the intent to buy. About 7 out of 10 store shoppers prefer to leave a store with a purchase in hand.
- If your store has an item out of stock, that’s not a problem for most consumers. 82 percent of shoppers are willing to have an item to them within the day.
- Companies that started online are expanding to physical stores, with 850 digital native brick-and-mortar stores expected to open in the next five years.
- Pop-up shops are rapidly growing in popularity and now generate $80 billion a year.
- Consumers who go clothes shopping like to see and touch what they are planning on wearing. Customers who try on clothes are more likely to buy. 85 percent of customers who entered a fitting room left with a purchase, compared to 58 percent who do not.
- 49 percent of shoppers cite not being able to touch, feel or try a product as one of their least favorite aspects of online shopping.
[wbcr_snippet id=”1090″]
The Importance of Displays in Driving Purchases
- Displays are an important component of any in-store experience. By utilizing visuals, retailers can improve message retention by a little less than half.
- Shoppers tend to have short attention spans – Retailers have on average 8 seconds to grab their attention
Impulse Shopping Statistics
- Impulse shopping continues to be a huge driver for retailers, with nearly 70 percent of in-store purchases being impulse buys. Additionally, 40 percent of overall purchases in the US are a result of impulse shopping.
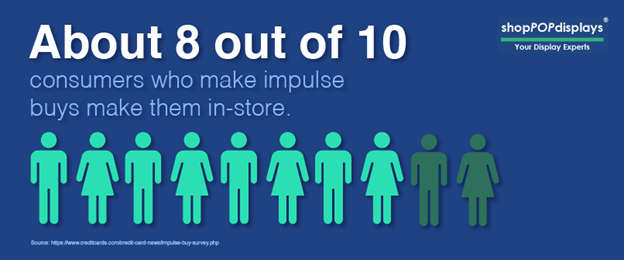
- Almost 8 out of 10 consumers who make impulse buys make them in-store.
- About 71 percent of people cite food as their most common impulse buy.
- The average American spends over $5,000 in impulse purchases in a year.
- Impulse purchases are common. 5 out of 6 Americans have admitted to buying a product or products impulsively. Additionally, 6 out of 10 women made an impulse purchase in the past year.
- Sales items are a great opportunity to encourage impulse sales. Nearly 90 percent of impulse buys occur due to an item being on sale.
The Effect of Sales on Consumer Behavior
- 8 out of 10 shoppers adapted their purchasing behavior based on coupon availability.
- When presented with a coupon or discount, nearly 40 percent of shoppers bought sooner and 35 percent spent more.
- 77 percent of consumers say discounts influence where they shop, and 48 percent say discounts can actually speed up their decision-making process.
Customer Experience Stats
- An improved customer experience is cited by executives as an important retail initiative globally. 44 percent of retail executives in the US, Germany, Japan, and the UK agreed that improving in-store experiences for customers was a high priority.
- 1 out of every 2 millennials don’t think sales associates are equipped to provide an optimal customer experience, specifically relating to technology.
- 8 out of 10 customers are willing to spend more money for a better customer experience. However, for brands with a bad customer experience, this can backfire. 3 out of 5 customers will change brands if they are promised a better customer experience.
- 40 percent of customers believe that retailers need to improve their in-store experiences.
- By 2020, more than 40 percent of data analytics projects will relate to customer experience.
- The inability to find an available store associate is a top challenge for 73 percent of home furnishing shoppers and 75 percent of outdoor gear shoppers
- 85 percent of consumers will abandon their purchases if not promptly assisted at dressing rooms.
The Value Customer Loyalty
- Most customers want personalized discounts based on their past purchase history. 76 percent find personalization important while 62 percent expect it.
- Over 8 out of 10 shoppers are loyal to retailers. This is beneficial for retailers, since most (65 percent) of a company’s revenue is a result of returning customers.
- If companies can lower their customer retention costs by just 2 percent, they can lower costs by as high as 10 percent.
- Attracting new customers can cost companies 6 to 7 times more than retaining their relationships with an existing one. In fact, it’s estimated that businesses lose $1.6 trillion from customers who have switched their loyalty away from a retailer or brand.
- Happy customers are a great way to attract new business with nearly 80 percent of customers willing to share businesses they love with their friends and family.
- Engaged customers make purchases 90 percent more often than those who are not engaged.
- 77 percent of consumers, including 60 percent of millennials, have had relationships with specific brands for more than 10 years.
- More than 70 percent of millennials and Gen Z belong to loyalty programs, compared to less than 20 percent of Baby Boomers.
- Loyal customers are 7x more likely to test an offering, 5x as likely to make a repeat purchase and 4x more likely to refer others to the brand.
Seasonal Shopping Statistics
Back to School Stats
- Back to school shoppers still prefer in-store, with 56 percent of survey respondents having made purchases at brick-and mortar locations and only 20 percent online.
- Back to school spending is expected to amount to $519 per student (or $27.8 billion). This breaks down as follows:
- $15 Billion on clothing/ accessories
- $6.1 Billion on school supplies
- $3.1 Billion on computers/ hardware
- $3.6 Billion on electronic gadgets
- Of the $27.8 billion estimated spend, $15.7 billion will be spent in store.
- 6 out of every 10 shoppers plan to start back-to-school shopping between mid-July and early August.
- 80 percent of shoppers cited convenience as an important consideration when selecting where to purchase their back to school items. This includes making it easy for consumers to find what they need.
- 1 out of 3 of consumers agree that sold out inventory was their biggest complaint, while nearly 20 percent of shoppers cited store disorganization or the inability to find what they need as their biggest annoyance.
- Sales and discounts also play a huge role in where shoppers choose to spend their money. 70 percent of in-store shoppers cited it as being their top driving factor for picking a retailer, and 63 percent of online shoppers agreed.
- Less than 2 percent of consumers plan to do all of their back-to-school shopping online.
Summertime Shopping
- Almost 37 percent of consumers shop in-store during the summer months and 33.4 percent of consumers shop in-store and online depending on the store.
- About 42 percent of Americans are spending most of their money on food in the summer months.
Black Friday & Cyber Monday Stats
- About 70 percent of shoppers plan on taking advantage of deals from Black Friday through Cyber Monday.
- 89 percent of shoppers plan to shop in store and 91 percent plan to shop online.
- About 40 percent of shoppers acknowledge that they will spend more than anticipated.
- Clothing and accessories are the most popular Black Friday items (65 percent) with electronics as a close second (55 percent).
- Black Friday is a social activity for most shoppers – Most consumers plan on visiting retail stores with their friends and family (64 percent).
- Early morning Black Friday shoppers (between 1AM and 5AM) outspend those shopping at later hours by almost $80 a person.
Staying Competitive in Today’s Marketplace
- 64 percent of surveyed US customers think retailers should offer a pick up in store option, when purchasing online.
- Only 3 out of every 10 shoppers say that their experience is completely connected between in-store and online.
- Nearly 8 out of 10 customers choose to make a purchase after browsing options online. In fact, nearly 90 percent of shoppers begin their shopping journeys online.
- 72 percent of customers made a purchase online after visiting a store
- By leveraging AI-based product recommendations, retailers can increase their average order value by 14 percent
- Consumers rely on digital tools, even when shopping in-store.
- Customers who use multiple channels to shop are more valuable, spending on average 4 percent more in store and 10 percent more online.
- When asked to choose between shopping between the marketplace, brands and retailers, customers will choose retailers when it comes down to customer service (57 percent). However, the marketplace and brands beat retailers out in nearly every other category including product variety and price, showing that retailers may have some opportunities to consider when competing with other channels.
- 70 percent of shoppers want to see new merchandise when going online or in-store.
- A brand’s values are important to shoppers and nearly half of shoppers (45 percent) are more likely to buy if a brand donates to a charity alongside a purchase.
- In the United States alone, retail accounts for $2.6 trillion in sales and retail consumer spending drives nearly 70 percent of economic growth.
- 88 percent of consumers who search for a type of local business on a mobile device call or go to that business within 24 hours.
- 73 percent of consumers use multiple channels to shop.

Final Thoughts
Need help planning your retail strategy by creating the right in-store experience. Our team can help! Contact us today to find out more.